Monitor resources of multiple sites/services

So I have installed three websites on a VPS with EasyEngine and am curious to learn how I can monitor the resources these websites (and things like PHP, MariaDB, RAM, CPU, etc.) without needing to log in with Putty and doing a top/htop.

Does anyone have any suggestions that can give a graphical UI current hardware resources, but possibly individual WordPress installs as well?

@Endda Checkout this thread - Server monitoring/performance logging

1 Like

YES! Late last night after trying to find out solutions for this type of monitoring, I came across netdata.

This seems perfect. . .but I am having trouble getting it to run behind NGINX I am new to EasyEngine and NGINX in general so I found this page

To be rather vague and not detailed enough for me to figure out how to get it working. I got the service running on the server, but when I tried to connect I was getting connection refused errors so I am pretty sure that I didn’t configure it properly to work with NGINX. And as that GitHub page seemed over my head (plus the fact that it was getting late), I had to give up on it last night.

If you, or anyone else out there has a step by step guide about getting netdata working on EasyEngine then I would greatly appreciate it.

Or maybe if there were someone out there that could just explain the running behind nginx part, that would be great (as I think I have the rest of it up and running as it should)

Try https://nodequery.com/
You can set up alerts for high usage which you will receive directly on mail.
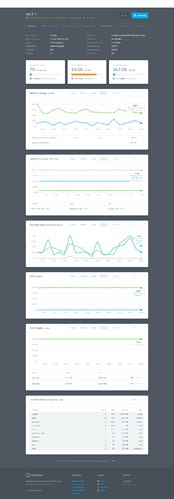
Here’s a snap of nodequery

I do appreciate the offer, but I’m not going to spend 8-10 dollars per month for the service once it is out of beta

:frowning:

Then try https://nixstats.com/#pricing It’s Free for 1 server and you can use multi email for more monitors. :smile:

BTW folks even netdata can send you mails on high usage! Check - https://github.com/netdata/netdata/wiki/health-monitoring

You can check https://github.com/netdata/netdata/wiki/health-configuration-examples for examples on how to configure it.

1 Like

Thanks for providing this link. I just removed other monitoring service and installed this one on all my VPS.

HI. I have been looking into netdata too. I have it installed on several servers. I decided it made the most sense to add it to the EE admin stuff on port 22222. So in the file /etc/nginx/sites-available/22222, I added the following:

# netdata rules
location /netdata {
    return 301 /netdata/;
}

location ~ /netdata/(?<ndpath>.*) {
    proxy_redirect off;
    proxy_set_header Host $host;

    proxy_set_header X-Forwarded-Host $host;
    proxy_set_header X-Forwarded-Server $host;
    proxy_set_header X-Forwarded-For $proxy_add_x_forwarded_for;
    proxy_http_version 1.1;
    proxy_pass_request_headers on;
    proxy_set_header Connection "keep-alive";
    proxy_store off;
    proxy_pass http://netdata/$ndpath$is_args$args;
    gzip on;
    gzip_proxied any;
    gzip_types *;
}

I put this after the location ~ \.php$ rule and before the # ViMbAdmin Rules comment. Reload nginx: nginx -t && service nginx reload and access it at https://yourserver.com:22222/netdata/

I haven’t managed to get the ‘monitor multiple servers from one’ working without making it public (register at the central location) yet.

This topic was automatically closed 30 days after the last reply. New replies are no longer allowed.