ERR_CONNECTION_TIMED_OUT (Nginx Fails, 100% CPU)

Hey Guys,
I am having a very strange issue with one of my VPS where I use EasyEngine along with the latest version of @virtubox Nginx-EE Script for additional features.

The Nginx Stucks at 100% CPU within 3-4 hours of starting it. There is no error logged from Nginx that I can diagnose. Once I restart the Nginx Server, everything becomes fine but just for 3-4 hours.

When the error occurs, all the sites show “ERR_CONNECTION_TIMED_OUT” Error. Following is the screenshot of htop command that I ran when the server was having this issue:

I have been using exactly same configuration on 2 More Ubuntu 18.04 based Server which has the same type of Wordpress websites on them.

But those 2 Servers are working really fine with the ditto setup.

I think I spoke too soon. The error still continues…

Whenever CPU Raises to 100% usage, the error logged by nginx is “worker process XXX exited on signal 9

I’m facing the very same issue. I worked on several workarounds this weekend, but no success on keeping servers actually working as usually.

I tested recompiling Nginx with every version from 14.0 to 15.15.5 with no different luck.

I’m now going to setup a brand new VPS with stock Nginx to see if the issue gets solved or if it’s the same with Nginx from the official repositories.

Hey Buddy, Kindly, keep me updated here whenever you get this issue resolved. Thanks

No relevant news so far. :frowning:

I had to increase CPU power in order to avoid Nginx crashing so often.

Also, I wrote a bash script that runs every minute (via cron) to restart Nginx before customers notice any downtime. In order to use it, the variable worker_processes in nginx.conf must be set to the exact number of CPU cores (not auto).

#!/bin/bash

RESTARTNGINX='N'

# Max CPU usage allowed: 30% x 100 = 3000
NGINXMAX=3000

# Measures only nginx worker processes
CARGASNGINX=$( ps aux | grep nginx | grep worker | grep -v grep | awk '{print $3*100}' )

# Any process above the limit? Change the flag
for C in ${CARGASNGINX}; do
    [ ${C} -gt ${NGINXMAX} ] && RESTARTNGINX='Y'
done

# Any process requiring restart?
if [ 'Y' == ${RESTARTNGINX} ]; then
    service nginx restart
fi

If you need any explanation on the script let me know.

You probably will have to try different thresholds until you find your “ideal” value (not so low it restarts Nginx too often, to so high it nevers restarts Nginx when needed).

1 Like

Thanks for the script mate. Do you use Custom Nginx Error Pages? I removed it and there is no Nginx failure since last 6-7 Hours.

Don’t know if the issue is fixed or not. If the server doesn’t get down by the tomorrow morning then I will assume it fixed else I will try the solution provided by you :slight_smile:

No, I don’t use it.

Hello @nschopra,

can you give me the output of the command nginx -V ?
Have you checked the amount of requests/connections on Nginx ?

You can display it with :

curl http://127.0.0.1/stub_status?full

Thanks for replying master.

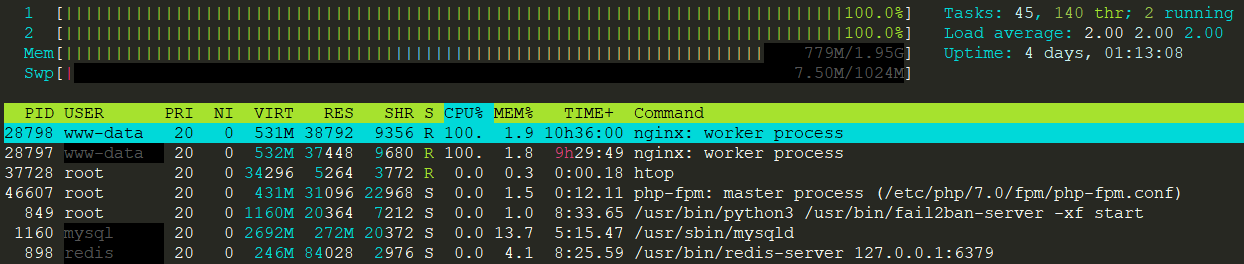
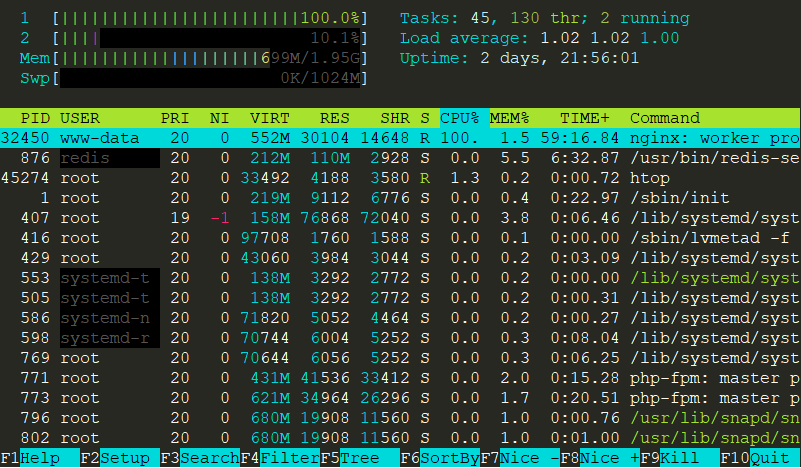
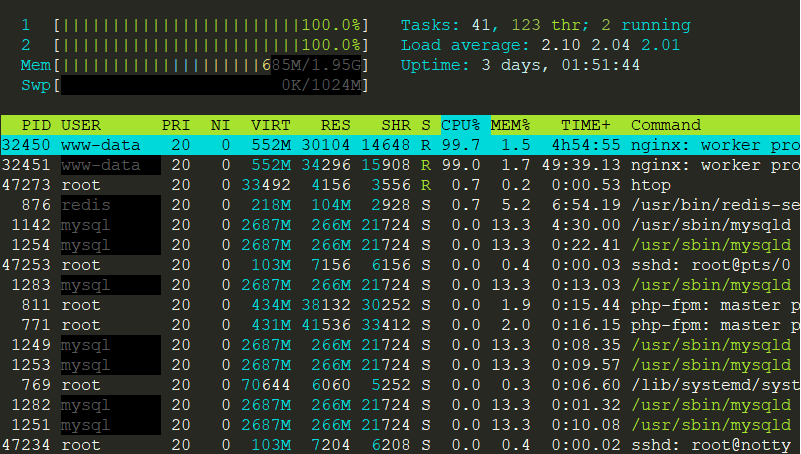
It has been almost 18 Hours yet the Nginx wasn’t failed but just now it happened again. When I checked through htop Command I found that Nginx Worker Process with PID 32450 is consuming 100% CPU as shown in the following image:

Then, I checked nginx error.log but it was empty. Later, I opened the particular site’s error log and found the following entry there:

2018/10/30 14:34:06 [error] 32450#32450: *470 access forbidden by rule, client: 219.91.191.146, server: examweb.in, request: "HEAD /https://www.examweb.in/ HTTP/1.1", host: "www.examweb.in"

2018/10/30 15:20:44 [error] 32450#32450: *1602 access forbidden by rule, client: 88.198.69.233, server: examweb.in, request: "GET /%E0%A4%A8%E0%A5%8B%E0%A4%9F%E0%A4%AC%E0%A4%82%E0%A4%A6%E0%A5%80-%E0%A4%AA%E0%A4%B0-%E0%A4%B2%E0%A5%87%E0%A4%96-%E0%A4%A8%25 HTTP/1.1", host: "www.examweb.in"

2018/10/30 17:23:43 [crit] 32450#32450: *5012 SSL_do_handshake() failed (SSL: error:1417D0A0:SSL routines:tls_process_client_hello:length too short) while SSL handshaking, client: 108.178.16.154, server: 0.0.0.0:443

One More Website’s Error Log

2018/10/30 21:17:42 [error] 32450#32450: *12453 access forbidden by rule, client: 115.235.172.205, server: ishaweb.in, request: "GET /motilal-nehru-sports-school-rai-admission... HTTP/1.1", host: "www.ishaweb.in"
    
2018/10/30 22:08:58 [error] 32450#32450: *13748 access forbidden by rule, client: 35.237.3.156, server: ishaweb.in, request: "GET /wp-json/wp/v2/posts/10725,%22href%22:%22https:%5C/%5C/www.ishaweb.in%5C/wp-json%5C/wp%5C/v2%5C/posts%5C/6627%5C/revisions%5C/10725%22%7D],%22wp:attachment%22:[%7B%22href%22:%22https:%5C/%5C/www.ishaweb.in%5C/wp-json%5C/wp%5C/v2%5C/media?parent=6627%22%7D],%22wp:term%22:[%7B%22taxonomy%22:%22category%22,%22embeddable%22:true,%22href%22:%22https:%5C/%5C/www.ishaweb.in%5C/wp-json%5C/wp%5C/v2%5C/categories?post=6627%22%7D,%7B%22taxonomy%22:%22post_tag%22,%22embeddable%22:true,%22href%22:%22https:%5C/%5C/www.ishaweb.in%5C/wp-json%5C/wp%5C/v2%5C/tags?post=6627%22%7D],%22curies%22:[%7B%22name%22:%22wp%22,%22href%22:%22https:%5C/%5C/api.w.org%5C/%7Brel%7D%22,%22templated%22:true%7D]%7D%7D,%7B%22id%22:6848 HTTP/1.1", host: "www.ishaweb.in"

Here is the output of commands you asked for:

nginx/1.15.5 (VirtuBox Nginx-ee)

AND

Active connections: 28
server accepts handled requests
 19948 19948 27961
Reading: 0 Writing: 2 Waiting: 26

This Digital Ocean VPS (Ubuntu 18.04) has up to date packages and security updates. I have 4 Simple Wordpress Sites on it which hardly gets 3-4 Thousand Visitors daily. All the sites uses authentic and up to date Themes and Plugins.

And now the Second CPU has also got 100% Usage by Nginx Worker Process with PID 32451 as shown in the following screenshot:

And here is the new log:

2018/10/31 14:31:48 [error] 32451#32451: *30900 access forbidden by rule, client: 144.76.235.84, server: ishaweb.in, request: "GET /wp-content/uploads/2018/08/seos.php HTTP/1.1", host: "www.ishaweb.in", referrer: "ishaweb.in"

2018/10/31 14:32:22 [error] 32451#32451: *30906 access forbidden by rule, client: 144.76.235.84, server: ishaweb.in, request: "GET /wp-content/uploads/2018/08/st.php HTTP/1.1", host: "www.ishaweb.in", referrer: "ishaweb.in"

2018/10/31 14:36:37 [error] 32451#32451: *30981 access forbidden by rule, client: 144.76.235.84, server: ishaweb.in, request: "GET /wp-content/uploads/2018/08/seo_script.php HTTP/1.1", host: "www.ishaweb.in", referrer: "ishaweb.in"

@virtubox Any suggestions, sir?

Hello @nschopra,

looks like someone is trying to hack your wordpress sites. Do you use the latest version of wpcommon-php72.conf?

You can try to setup nginx-ultimate-bad-bot-blocker to block bad bots with Nginx, and/or configure fail2ban to ban IP after several forbidden access.

Hello Master,

These attacks are normal and I have been noticing them since a long time. Even their access is being blocked due to the rules we have used for the protections.

I have been using the latest version of WP Common PHP 7.2 and fail2ban with all the Custom Jails provided by you.

I am configuring Nginx Ultimate Bad Bot Blocker right now but I don’t think it will resolve the issue. Will keep the thread updated…

Hello @nschopra,

Okay I understand. That’s the first time I see an issue with Nginx using too much CPU. On my servers, Nginx worker process use CPU only when there are several files downloaded from the server, and it do not use more than 15-20% of a single core. You can try nmon to get more informations about resources usage than with htop.

apt install nmon

Thanks, Master, I will dig it more. However, I really liked Nginx Bad Bot Blocker concept but it throws the following error in the end and breaks the nginx configuration:

[emerg] "if" directive is not allowed here in /etc/nginx/bots.d/blockbots.conf:40

Tried the workarounds posted in this thread but couldn’t get it worked yet. I wish there was an article on Virtubox’s Knowledge Base about configuring this ultimate bots solution.

Hello @nschopra,

just check if directive include /etc/nginx/bots.d/blockbots.conf; was properly added in your vhost by nginx bad bot blocker script. There were few errors in 22222 and default nginx vhosts in my case.

I finally got it working but there is just one issue. As per the official thread, curl -A “Xenu Link Sleuth/1.3.8” http ://yourdomain.com or curl -I https ://yourdomain.com -e http ://zx6.ru should output the following line:

curl: (52) Empty reply from server

But in my case, there is the following output:

curl: (92) HTTP/2 stream 1 was not closed cleanly: PROTOCOL_ERROR (err 1)

It’s not an error, connection isn’t closed with the same message when you use HTTP/2.

So, I guess the setup is completed and it’s working fine. Tested it through some WP Theme Detector Sites and they were unable to access my sites.

But even after installing it there are some attempts listed in site-error log which were unsuccessful but still the Nginx CPU Memory issue is same.